Strings and factors
Most of the tools we examined in Data Wrangling I were general
purpose things – what tidy data is, using dplyr and
tidyr for manipulation of data tables. Two variable types,
strings and factors, present enough challenges to examine in some
detail. Now might also be a good time to read up on the history
of strings and factors in R!
This is the second module in the Data Wrangling II topic.
Overview
Learning Objectives
Edit/manipulate strings and take control of factors.
Video Lecture
Example
I’ll write code for today’s content in a new R Markdown document
called strings_and_factors.Rmd, and put it in the same
directory / GitHub repo as reading_data.Rmd. Since we’ll
revisit some scraped examples, I’ll load rvest now; we’ll
also use some datasets in p8105.datasets so I’ll load that
as well. And finally, we’ll use some of these examples, so I’ll
make sure I have them in a data subdirectory..
library(rvest)
library(p8105.datasets)
Strings and regex
Lots of the examples below are drawn from materials by Jeff Leek.
The most frequent operation involving strings is to search for an
exact match. You can use str_detect to find cases where the
match exists (often useful in conjunction with filter), and
you can use str_replace to replace an instance of a match
with something else (often useful in conjunction with
mutate). In the following examples we’ll mostly focus on
vectors to avoid the complication of data frames, but we’ll see those
shortly.
string_vec = c("my", "name", "is", "jeff")

str_detect(string_vec, "jeff")
## [1] FALSE FALSE FALSE TRUEstr_replace(string_vec, "jeff", "Jeff")## [1] "my" "name" "is" "Jeff"For exact matches, you can designate matches at the beginning or end of a line.
string_vec = c(
  "i think we all rule for participating",
  "i think i have been caught",
  "i think this will be quite fun actually",
  "it will be fun, i think"
  )

str_detect(string_vec, "^i think")
## [1] TRUE TRUE TRUE FALSEstr_detect(string_vec, "i think$")## [1] FALSE FALSE FALSE TRUEYou can designate a list of characters that will count as a match.
string_vec = c(
  "Time for a Pumpkin Spice Latte!",
  "went to the #pumpkinpatch last weekend",
  "Pumpkin Pie is obviously the best pie",
  "SMASHING PUMPKINS -- LIVE IN CONCERT!!"
  )

str_detect(string_vec,"[Pp]umpkin")
## [1] TRUE TRUE TRUE FALSEYou don’t have to list these; instead, you can provide a range of letters or numbers that count as a match.
string_vec = c(
  '7th inning stretch',
  '1st half soon to begin. Texas won the toss.',
  'she is 5 feet 4 inches tall',
  '3AM - cant sleep :('
  )

str_detect(string_vec, "^[0-9][a-zA-Z]")
## [1] TRUE TRUE FALSE TRUEThe character . matches anything.
string_vec = c(
  'Its 7:11 in the evening',
  'want to go to 7-11?',
  'my flight is AA711',
  'NetBios: scanning ip 203.167.114.66'
  )

str_detect(string_vec, "7.11")
## [1] TRUE TRUE FALSE TRUESome characters are “special”. These include [ and
], ( and ), and ..
If you want to search for these, you have to indicate they’re special
using \. Unfortunately, \ is also special, so
things get weird.
string_vec = c(
  'The CI is [2, 5]',
  ':-]',
  ':-[',
  'I found the answer on pages [6-7]'
  )

str_detect(string_vec, "\\[")
## [1] TRUE FALSE TRUE TRUEThere are a lot of other regular expression resources; we’re really
only scratching the surface. The stuff we have already will be useful
and it’s probably not worth going down the regex rabbit hole. That said,
it’s helpful to know what other functions exist in stringr
– you should at least know they exist even if you don’t know exactly how
they work right now!
Thoughts on factors
Factors are maybe the least intuitive of R’s data types.
They are very useful, but they also do things you don’t expect; this is
especially bad when you have factors but think you have characters –
which happens more than you’d expect, because R uses factors a lot (mostly
for historical reasons). Folks get pretty riled
up
about factors.
Factors are the way to store categorical variables in R. They can take on specific levels (e.g. male and female) which are usually presented as characters but are, in fact, stored by R as integers. These integer values are used by functions throughout R – in making plots, in organizing tables, in determining the “reference” category – but most of the time are hidden by easier-to-read character string labels. This close relationship to strings, when in fact there is a lot of added structure, is why factors can be so confusing.
This is the kind of thing that can get you in trouble.
vec_sex = factor(c("male", "male", "female", "female"))
vec_sex
## [1] male male female female
## Levels: female maleas.numeric(vec_sex)## [1] 2 2 1 1vec_sex = fct_relevel(vec_sex, "male")
vec_sex## [1] male male female female
## Levels: male femaleas.numeric(vec_sex)## [1] 1 1 2 2The previous code also illustrates coersion: forcing a variable from one type (e.g. factor) to another (e.g. numeric). Understanding how R coerces variables is important, because it sometimes happens unintentionally and can break your code or impact your analyses.
For this reason, it’s important to be deliberate factors,
particularly by using functions in forcats.
NSDUH
We’ll revisit the table scraped from the National Survey on Drug Use and Health data on this page. In reading data from the web, we loaded this data using the code below, but noted it wasn’t tidy.
nsduh_url = "http://samhda.s3-us-gov-west-1.amazonaws.com/s3fs-public/field-uploads/2k15StateFiles/NSDUHsaeShortTermCHG2015.htm"

table_marj =
  read_html(nsduh_url) |>
  html_table() |>
  first() |>
  slice(-1)
There are a few steps we need to implement to tidy these data. For now I’m not interested in the p-values (I’d rather just see the data); we also have age groups and year ranges in column titles, both of which are, in fact, variables. Lastly, the table includes letters as superscripts next to table entries; if we only want the percents we’ll need to strip these out.
data_marj =
  table_marj |>
  select(-contains("P Value")) |>
  pivot_longer(
    -State,
    names_to = "age_year",
    values_to = "percent") |>
  separate(age_year, into = c("age", "year"), sep = "\\(") |>
  mutate(
    year = str_replace(year, "\\)", ""),
    percent = str_replace(percent, "[a-c]$", ""),
    percent = as.numeric(percent)) |>
  filter(!(State %in% c("Total U.S.", "Northeast", "Midwest", "South", "West")))
We used stringr and regular expressions a couple of
times above:
- in
separate, we split age and year at the open parentheses using"\\(" - we stripped out the close parenthesis in
mutate - to remove character superscripts, we replaced any character using
"[a-c]$"
Let’s quickly visualize these data for the 12-17 age group; to make
the plot readable, we’ll treat State as a factor are
reorder according to the median percent value.
data_marj |>
  filter(age == "12-17") |>
  mutate(State = fct_reorder(State, percent)) |>
  ggplot(aes(x = State, y = percent, color = year)) +
    geom_point() +
    theme(axis.text.x = element_text(angle = 90, hjust = 1))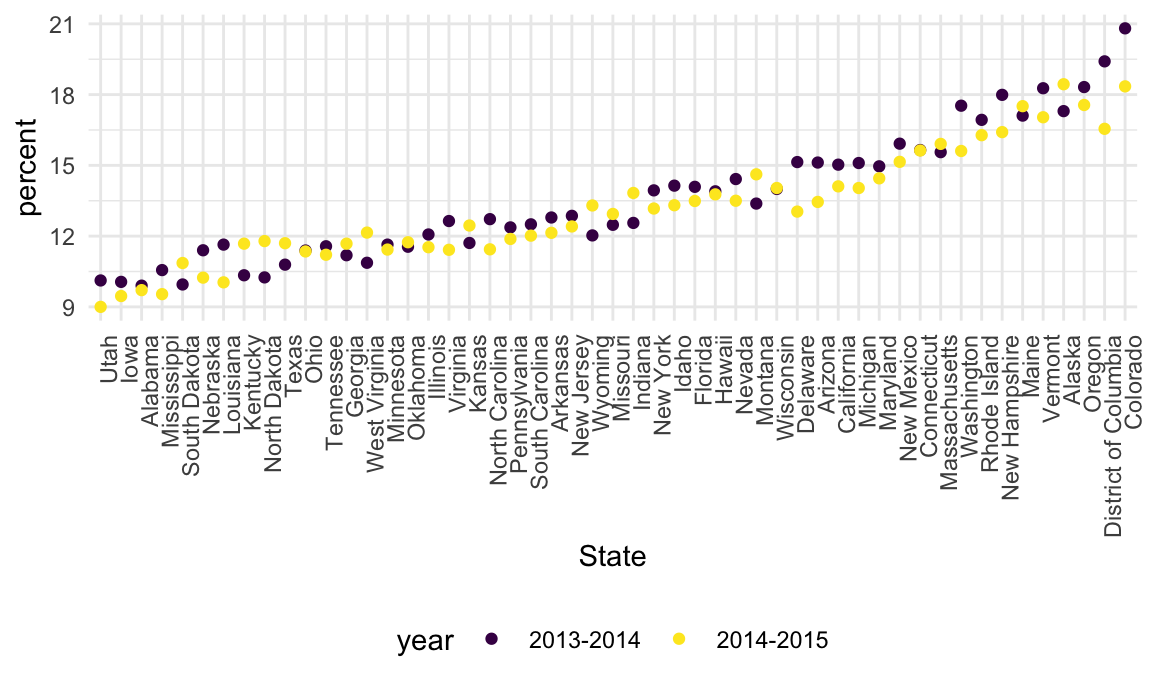
Restaurant inspections
As a kind of involved example of strings and factors, we’ll take a look at the NYC Restuarant Inspections data. Although we won’t talk about this in detail now, it’s worth mentioning that these data were collected using the NYC Open Data API; code is available with the data description.
First we’ll import the data and take a look.
data("rest_inspec")

rest_inspec |>
  group_by(boro, grade) |>
  summarize(n = n()) |>
  pivot_wider(names_from = grade, values_from = n)
## `summarise()` has grouped output by 'boro'. You can override using the
## `.groups` argument.## # A tibble: 6 × 8
## # Groups: boro [6]
## boro A B C `Not Yet Graded` P Z `NA`
## <chr> <int> <int> <int> <int> <int> <int> <int>
## 1 BRONX 13688 2801 701 200 163 351 16833
## 2 BROOKLYN 37449 6651 1684 702 416 977 51930
## 3 MANHATTAN 61608 10532 2689 765 508 1237 80615
## 4 Missing 4 NA NA NA NA NA 13
## 5 QUEENS 35952 6492 1593 604 331 913 45816
## 6 STATEN ISLAND 5215 933 207 85 47 149 6730To simplify things, I’ll remove inspections with scores other than
A, B, or C, and also remove the
restaurants with missing boro information. I’ll also clean up boro names
a bit.
rest_inspec =
  rest_inspec |>
  filter(grade %in% c("A", "B", "C"), boro != "Missing") |>
  mutate(boro = str_to_title(boro))
Let’s focus only on pizza places for now, and re-examine grades by borough.
rest_inspec |>
  filter(str_detect(dba, "Pizza")) |>
  group_by(boro, grade) |>
  summarize(n = n()) |>
  pivot_wider(names_from = grade, values_from = n)
## `summarise()` has grouped output by 'boro'. You can override using the
## `.groups` argument.## # A tibble: 5 × 3
## # Groups: boro [5]
## boro A B
## <chr> <int> <int>
## 1 Bronx 9 3
## 2 Brooklyn 6 NA
## 3 Manhattan 26 8
## 4 Queens 17 NA
## 5 Staten Island 5 NAThat doesn’t look right – for sure there are more pizza place ratings
than that! The problem is that the match in str_detect is
case-sensitive until we tell it not to be:
rest_inspec |>
  filter(str_detect(dba, "[Pp][Ii][Zz][Zz][Aa]")) |>
  group_by(boro, grade) |>
  summarize(n = n()) |>
  pivot_wider(names_from = grade, values_from = n)
## `summarise()` has grouped output by 'boro'. You can override using the
## `.groups` argument.## # A tibble: 5 × 4
## # Groups: boro [5]
## boro A B C
## <chr> <int> <int> <int>
## 1 Bronx 1170 305 56
## 2 Brooklyn 1948 296 61
## 3 Manhattan 1983 420 76
## 4 Queens 1647 259 48
## 5 Staten Island 323 127 21The table is okay but I’d like to visualize this.
rest_inspec |>
  filter(str_detect(dba, "[Pp][Ii][Zz][Zz][Aa]")) |>
  ggplot(aes(x = boro, fill = grade)) +
geom_bar() 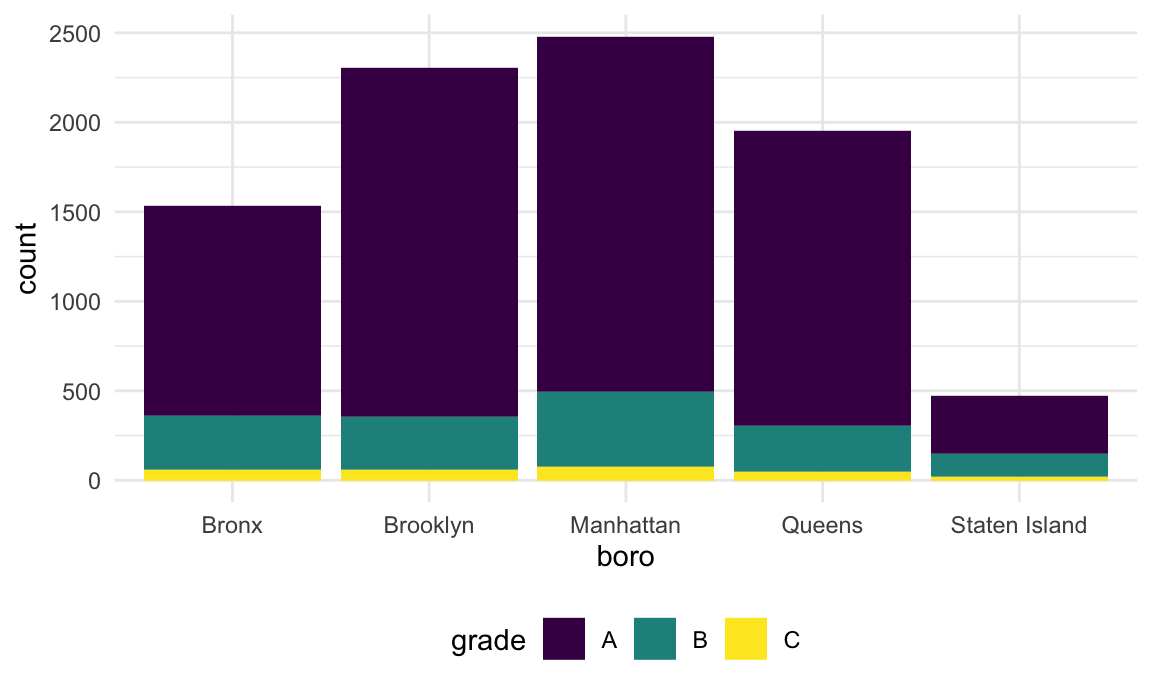
Might help to have things in a different order – maybe number of
pizza places? Fortunately this can be done using
fct_infreq.
rest_inspec |>
  filter(str_detect(dba, "[Pp][Ii][Zz][Zz][Aa]")) |>
  mutate(boro = fct_infreq(boro)) |>
  ggplot(aes(x = boro, fill = grade)) +
geom_bar() 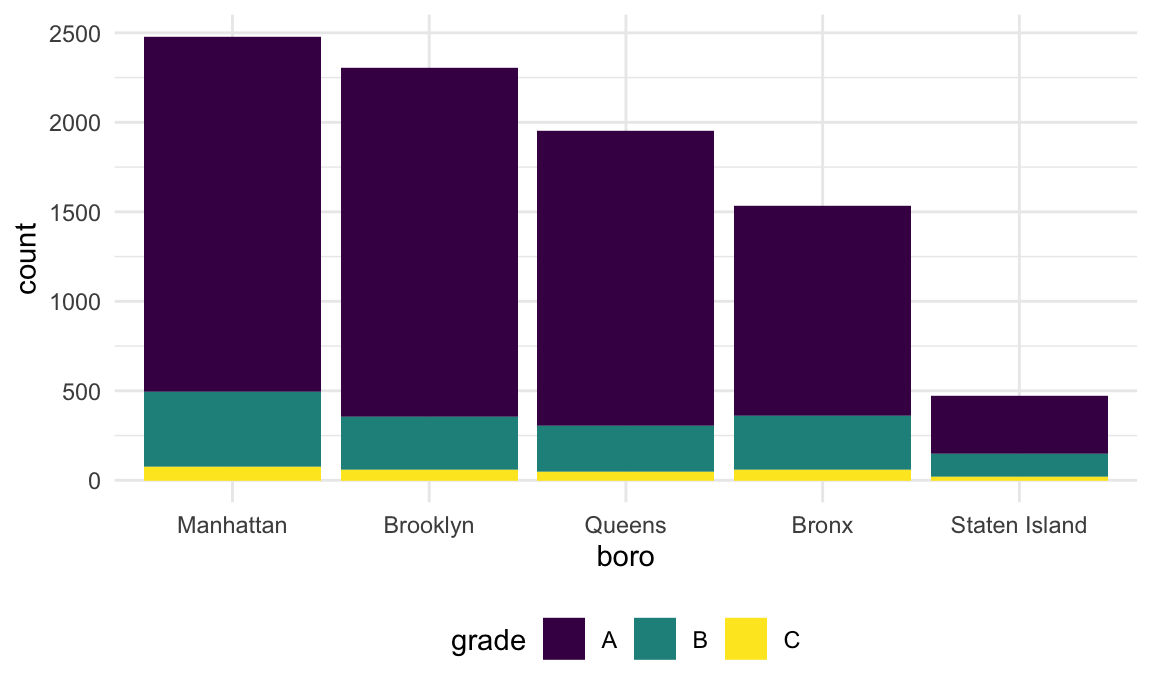
Suppose I want to rename a borough. I could try using
str_replace.
rest_inspec |>
  filter(str_detect(dba, "[Pp][Ii][Zz][Zz][Aa]")) |>
  mutate(
    boro = fct_infreq(boro),
    boro = str_replace(boro, "Manhattan", "The City")) |>
  ggplot(aes(x = boro, fill = grade)) +
geom_bar() 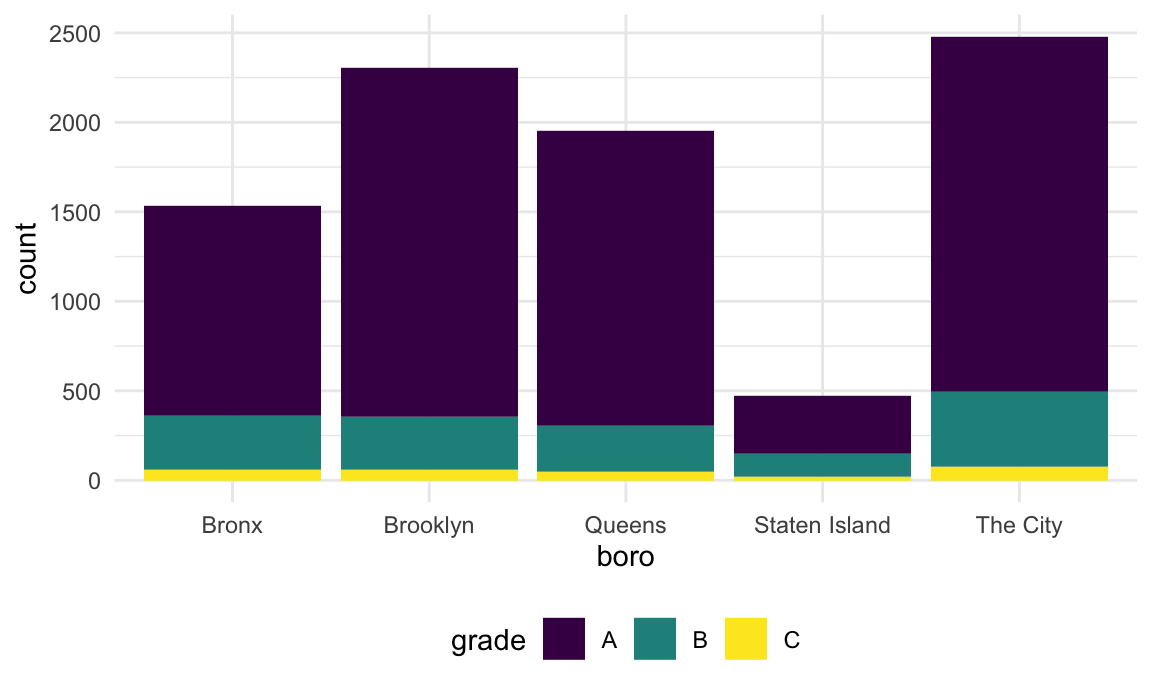
This renamed the borough, but then converted the result back to a string – which, when plotted, was implicitly made a factor and ordered alphabetically. I could switch the order in which I rename and encode the factor order I want, but that might not always work.
If I tried base R (maybe because I found some code online), I might
try to do this using replace.
rest_inspec |>
  filter(str_detect(dba, "[Pp][Ii][Zz][Zz][Aa]")) |>
  mutate(
    boro = fct_infreq(boro),
    boro = replace(boro, which(boro == "Manhattan"), "The City")) |>
  ggplot(aes(x = boro, fill = grade)) +
  geom_bar()
## Warning: There was 1 warning in `mutate()`.
## ℹ In argument: `boro = replace(boro, which(boro == "Manhattan"), "The City")`.
## Caused by warning in `[<-.factor`:
## ! invalid factor level, NA generated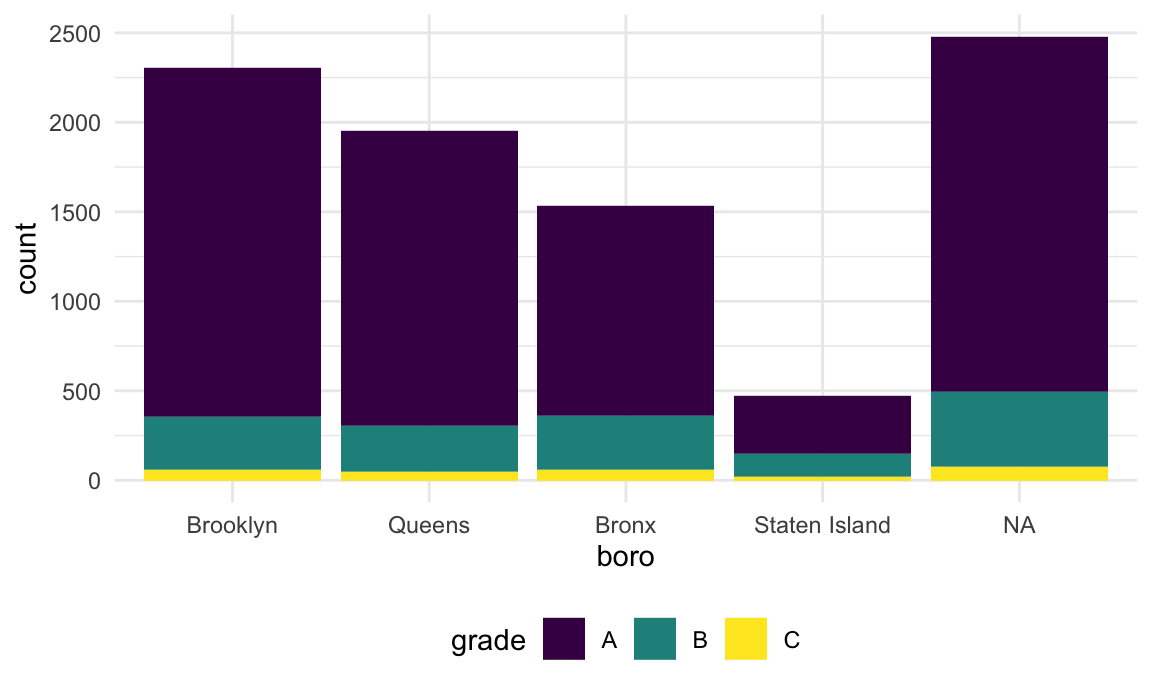
That didn’t work at all! Factors have very specific values, trying to use a value that is not an existing factor level won’t work.
Fortunately there is a dedicated function for renaming factor levels:
rest_inspec |>
  filter(str_detect(dba, regex("pizza", ignore_case = TRUE))) |>
  mutate(
    boro = fct_infreq(boro),
    boro = fct_recode(boro, "The City" = "Manhattan")) |>
  ggplot(aes(x = boro, fill = grade)) +
  geom_bar()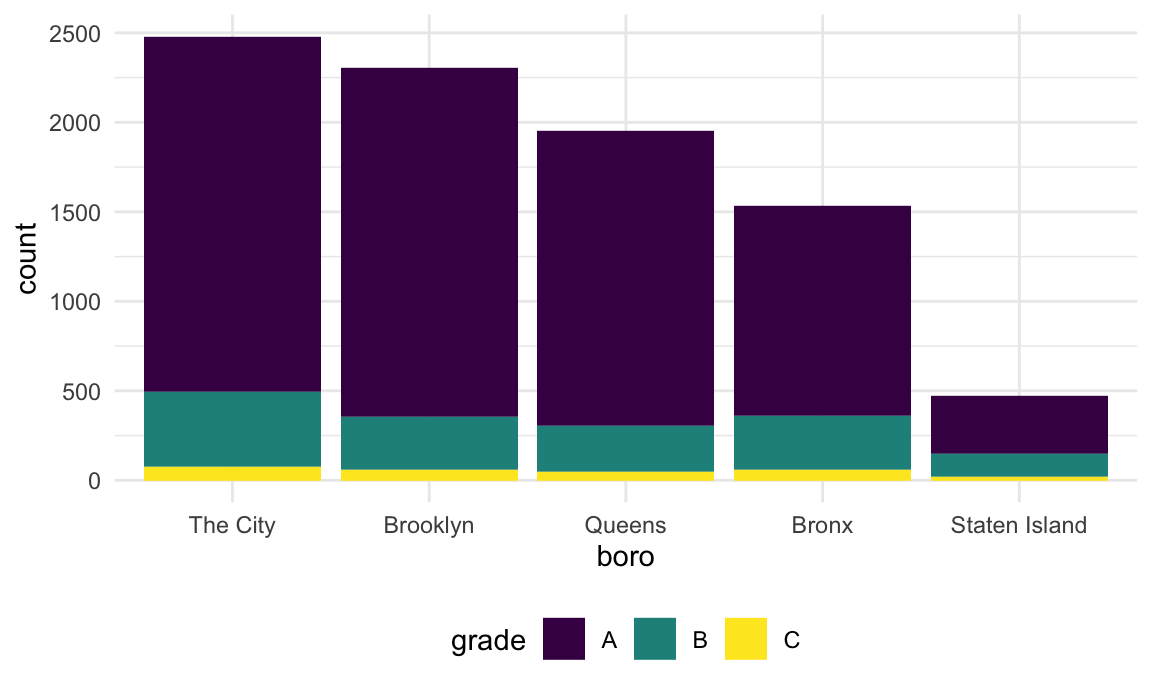
Success!
Weather data
We saw factors in in Viz Pt 2.
In that case, we were interested in reordering a factor variable in
order to produce clearer plots – ggplot uses factor levels
to determine the order in which categories appear. Let’s revisit those
examples now.
Our first step is to load the data we used.
weather_df =
  rnoaa::meteo_pull_monitors(
    c("USW00094728", "USW00022534", "USS0023B17S"),
    var = c("PRCP", "TMIN", "TMAX"),
    date_min = "2021-01-01",
    date_max = "2023-12-31") |>
  mutate(
    name = recode(
      id,
      USW00094728 = "CentralPark_NY",
      USW00022534 = "Molokai_HI",
      USS0023B17S = "Waterhole_WA"),
    tmin = tmin / 10,
    tmax = tmax / 10) |>
  select(name, id, everything())
## Registered S3 method overwritten by 'hoardr':
## method from
## print.cache_info httr## using cached file: /Users/jeffgoldsmith/Library/Caches/org.R-project.R/R/rnoaa/noaa_ghcnd/USW00094728.dly## date created (size, mb): 2023-09-19 15:41:55.07359 (8.524)## file min/max dates: 1869-01-01 / 2023-09-30## using cached file: /Users/jeffgoldsmith/Library/Caches/org.R-project.R/R/rnoaa/noaa_ghcnd/USW00022534.dly## date created (size, mb): 2023-09-25 10:06:23.827176 (3.83)## file min/max dates: 1949-10-01 / 2023-09-30## using cached file: /Users/jeffgoldsmith/Library/Caches/org.R-project.R/R/rnoaa/noaa_ghcnd/USS0023B17S.dly## date created (size, mb): 2023-09-19 15:42:03.139582 (0.994)## file min/max dates: 1999-09-01 / 2023-09-30weather_df## # A tibble: 3,009 × 6
## name id date prcp tmax tmin
## <chr> <chr> <date> <dbl> <dbl> <dbl>
## 1 CentralPark_NY USW00094728 2021-01-01 157 4.4 0.6
## 2 CentralPark_NY USW00094728 2021-01-02 13 10.6 2.2
## 3 CentralPark_NY USW00094728 2021-01-03 56 3.3 1.1
## 4 CentralPark_NY USW00094728 2021-01-04 5 6.1 1.7
## 5 CentralPark_NY USW00094728 2021-01-05 0 5.6 2.2
## 6 CentralPark_NY USW00094728 2021-01-06 0 5 1.1
## # ℹ 3,003 more rowsOur first example reordered name “by hand” using
fct_relevel:
weather_df |>
  mutate(name = forcats::fct_relevel(name, c("Molokai_HI", "CentralPark_NY", "Waterhole_WA"))) |>
  ggplot(aes(x = name, y = tmax)) +
  geom_violin(aes(fill = name), color = "blue", alpha = .5) +
  theme(legend.position = "bottom")
We could instead reorder name according to
tmax values in each name using
fct_reorder:
weather_df |>
  mutate(name = forcats::fct_reorder(name, tmax)) |>
  ggplot(aes(x = name, y = tmax)) +
  geom_violin(aes(fill = name), color = "blue", alpha = .5) +
  theme(legend.position = "bottom")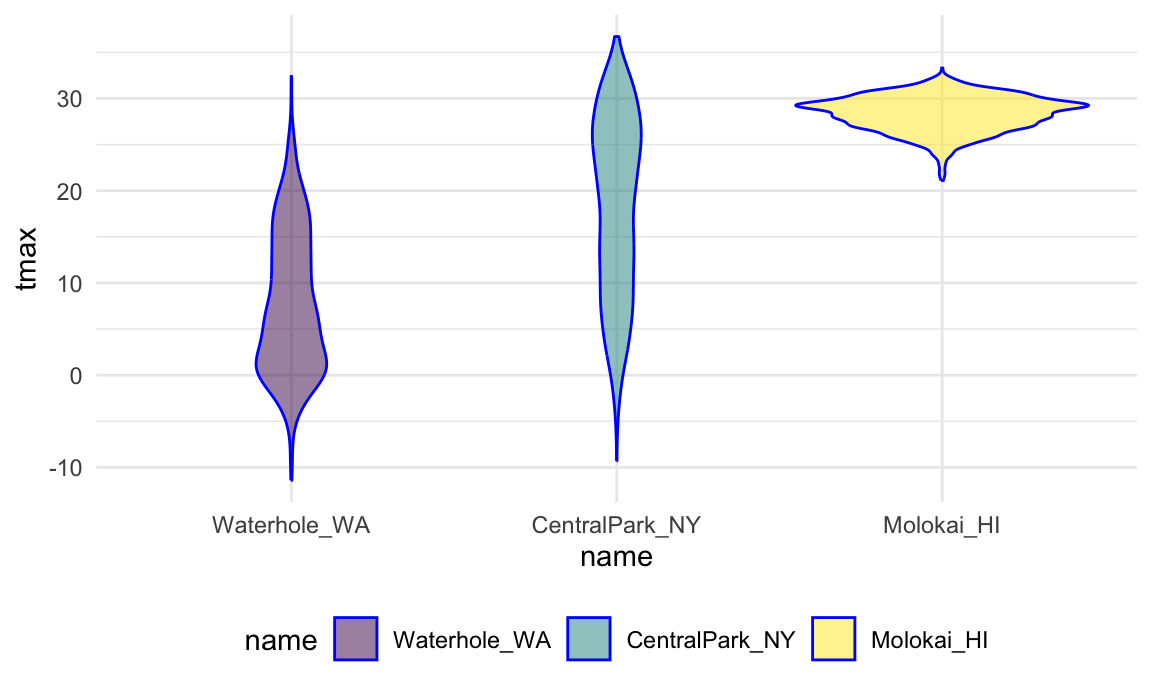
Although you may not have seen linear regression previously, the ordering of factor variables play an important in this case as well. Specifically, the ordering determines the “reference” category, and is something that can be adjusted as needed.
weather_df |>
  lm(tmax ~ name, data = _)
##
## Call:
## lm(formula = tmax ~ name, data = weather_df)
##
## Coefficients:
## (Intercept) nameMolokai_HI nameWaterhole_WA
## 18.24 10.12 -10.51weather_df |>
mutate(name = forcats::fct_relevel(name, c("Molokai_HI", "CentralPark_NY", "Waterhole_WA"))) |>
lm(tmax ~ name, data = _)##
## Call:
## lm(formula = tmax ~ name, data = mutate(weather_df, name = forcats::fct_relevel(name,
## c("Molokai_HI", "CentralPark_NY", "Waterhole_WA"))))
##
## Coefficients:
## (Intercept) nameCentralPark_NY nameWaterhole_WA
## 28.37 -10.12 -20.63In this example, we’re also using a feature of |>
that allows us to specify where the tibble goes: _ is a
placeholder for the result of the preceding call.
PULSE data
Let’s revisit a dataset we’ve seen a few times now. In tidy data we spent some time tidying the PULSE dataset. As part of that we used tools available to us at the time, but now we have some better tools.
The code below updates the data processing pipeline for the PULSE
data using stringr and forcats. The result is
the same, and the differences are pretty small, but this is a bit
cleaner.
pulse_data =
  haven::read_sas("./data/public_pulse_data.sas7bdat") |>
  janitor::clean_names() |>
  pivot_longer(
    bdi_score_bl:bdi_score_12m,
    names_to = "visit",
    names_prefix = "bdi_score_",
    values_to = "bdi") |>
  select(id, visit, everything()) |>
  mutate(
    visit = str_replace(visit, "bl", "00m"),
    visit = factor(visit)) |>
  arrange(id, visit)

print(pulse_data, n = 12)
## # A tibble: 4,348 × 5
## id visit age sex bdi
## <dbl> <fct> <dbl> <chr> <dbl>
## 1 10003 00m 48.0 male 7
## 2 10003 01m 48.0 male 1
## 3 10003 06m 48.0 male 2
## 4 10003 12m 48.0 male 0
## 5 10015 00m 72.5 male 6
## 6 10015 01m 72.5 male NA
## 7 10015 06m 72.5 male NA
## 8 10015 12m 72.5 male NA
## 9 10022 00m 58.5 male 14
## 10 10022 01m 58.5 male 3
## 11 10022 06m 58.5 male 8
## 12 10022 12m 58.5 male NA
## # ℹ 4,336 more rowsAirbnb
We could also use factors in an exploratory analysis of the Airbnb data, for example when looking at the distribution of prices in various neighborhoods. Ordering these according to the median price makes for clearer plots than ordering neighborhoods alphabetically.
data("nyc_airbnb")

nyc_airbnb |>
  filter(neighbourhood_group == "Manhattan") |>
  mutate(
    neighbourhood = fct_reorder(neighbourhood, price)) |>
  ggplot(aes(x = neighbourhood, y = price)) +
  geom_boxplot() +
  coord_flip() +
  ylim(0, 1000)
Other materials
- R for Data Science has chapters on both strings / regex and factors
- There are useful materials by Jenny Bryan on strings / regex and factors as well
- Dealing with text entries can be a real challenge
- Cheatsheet for stringr
The code that I produced working examples in lecture is here.