What is Data Science?
In this, we’ll provide a basic definition of “data science” and discuss the connotation of the term in several contexts.
Overview
Learning Objectives
Define “data science” and understand its vital role in public health research.
Video Lecture
Example
For the purpose of this class, we’ll use the following working definition of data science:
Data science is the study of formulating and rigorously answering questions using a data-centric process that emphasizes clarity, reproducibility, effective communication, and ethical practices.
In coming modules, we’ll learn about wrangling data, making visualizations, and conducting analyses. Throughout, we’ll focus on modern tools that facilitate best practices for working with data, including organization, reproducibility, and clear coding. Material will be presented in a way that combines didactic content with hands-on coding elements. Below are two examples we’ll return to later in the course.
Before introducing these, I’ll load the tidyverse.
library(tidyverse)
## ── Attaching core tidyverse packages ──────────────────────── tidyverse 2.0.0 ──
## ✔ dplyr     1.1.4     ✔ readr     2.1.5
## ✔ forcats   1.0.0     ✔ stringr   1.5.1
## ✔ ggplot2   3.5.2     ✔ tibble    3.3.0
## ✔ lubridate 1.9.4     ✔ tidyr     1.3.1
## ✔ purrr     1.1.0
## ── Conflicts ────────────────────────────────────────── tidyverse_conflicts() ──
## ✖ dplyr::filter() masks stats::filter()
## ✖ dplyr::lag()    masks stats::lag()
## ℹ Use the conflicted package (<http://conflicted.r-lib.org/>) to force all conflicts to become errors
The next chunk of code loads a tidy example dataset, which includes daily record of several weather-related variables at each of three weather stations.
library(p8105.datasets)
data("weather_df")
As we’ll discuss, a major element of working with data is producing
visualizations. The plot below shows the maximum temperature at each of
the three stations, as well as smooth trends over time to illustrate
seasonal effects. This is produced using ggplot, a package
in the tidyverse that we’ll talk more about soon.
weather_df |>
  ggplot(aes(x = date, y = tmax, color = name)) +
  geom_point(alpha = .5) +
  geom_smooth(se = FALSE) +
  theme(legend.position = "bottom")
## `geom_smooth()` using method = 'loess' and formula = 'y ~ x'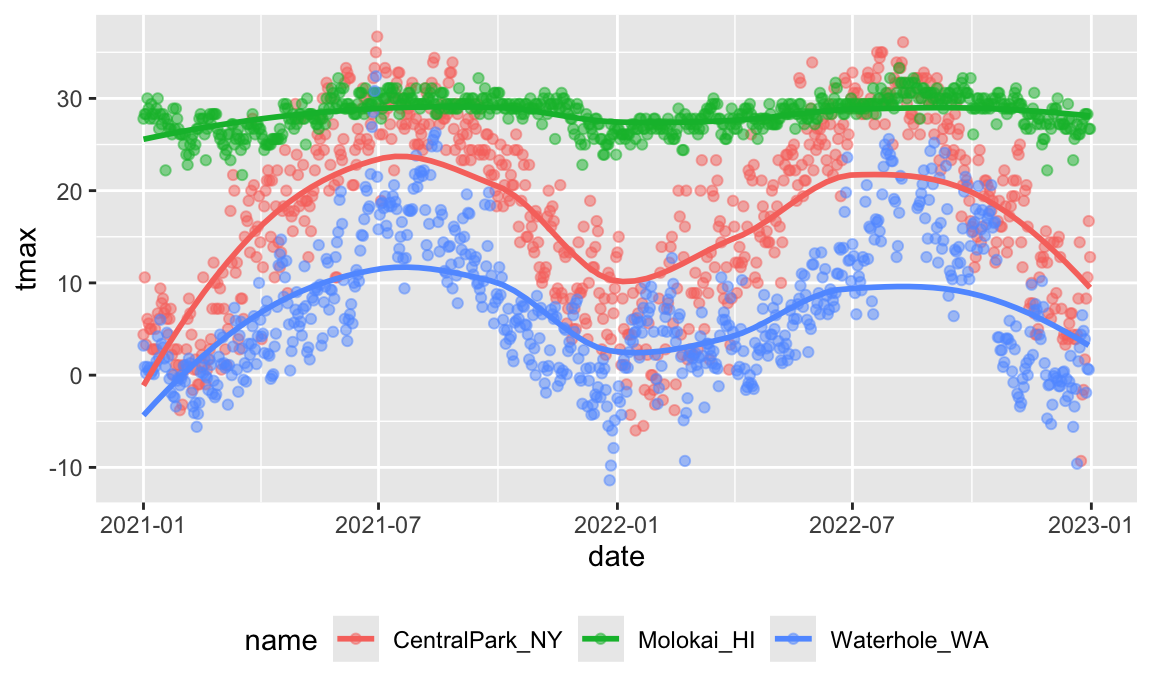
The next example uses data on Airbnb rentals in NYC, and is a bit more complex. The code below combines several steps to produce a map showing a sample of 5000 rentals in Brooklyn, Manhattan, and Queens; some important information (average rating, price, number of reviews) can be found by interacting with the map itself.
library(leaflet)
library(p8105.datasets)

data("nyc_airbnb")

nyc_airbnb =
  nyc_airbnb |>
  mutate(stars = review_scores_location / 2) |>
  rename(boro = neighbourhood_group)

pal <- colorNumeric(
  palette = "viridis",
  domain = nyc_airbnb$stars)

nyc_airbnb |>
  filter(boro %in% c("Manhattan", "Brooklyn", "Queens")) |>
  na.omit(stars) |>
  sample_n(5000) |>
  mutate(
    click_label =
      str_c("<b>$", price, "</b><br>", stars, " stars<br>", number_of_reviews, " reviews")) |>
  leaflet() |>
  addProviderTiles(providers$CartoDB.Positron) |>
  addCircleMarkers(~lat, ~long, radius = .1, color = ~pal(stars), popup = ~click_label)
Other materials
Lots of folks have opinions about what data science is. Here’s a collection of things that are worth reading (or watching).
- There was a session at JSM 2015 called “The statistics identity
crisis: am I really a data scientist?”. All the talks were great; for
now, two are especially relevant:
- Alyssa Frazee’s “Am I a Data Scientist?”
- Chris Volinsky’s “How Industry Views Data Science Education in Statistics Departments”
- Hilary Parker’s “Opinionated Analysis Development” is a strong argument in favor of having opinions. There’s also her paper on this topic.
- Angela Bassa talks about “Corporate Data Science”, which is useful complement to academic data science
- This paper on reproducibility is great
- The CPG Grey video on How Machines Learn is a really useful primer
We also touched on useful resources for learning data science. Each class session will have relevant readings; the following are useful in giving an overview about how to learn and find help.
- stackoverflow has a useful guide on how to ask a good question
- Julia Evan’s blog also has a useful guide how to ask good questions (note: hers has a cartoon!)
- (Tip: the fact that there are guides on asking questions means it isn’t always easy or obvious how to do it well. That’s fine! Learning how to ask the right questions is important, and you should practice.)
- This blog post and the follow-up disavowal are both interesting; one deals with learning to program and asking questions, and the other notes that flippant answers online are discouraging to people who want to learn but regretfully common.